April 16, 2026
Beyond Price Per Square Foot
In the Tennis Homes portfolio, waterfront tennis estates show a median price 3.8 times higher than inland estates of similar size. The court quality isn’t necessarily 3.8 times better. The surface type doesn’t fully account for the difference.
This suggests location drives value in ways price per square foot can’t capture.
Across 70 properties spanning 20 countries and price ranges from $1.6 million to $157 million, price per square foot varies by 5,000x. What we’ve observed is how dramatically the metric breaks down as a valuation tool for tennis estates—and what patterns emerge when properties share professional tennis courts but little else.
The 5,000x Gap
Price per square foot across the Tennis Homes portfolio ranges from $0.50 to $2,530. That’s a 5,000x variation.
Put another way: the metric that’s supposed to help you evaluate properties spans five orders of magnitude. At that point, it’s not a metric—it’s noise.
Here’s what happens when you try to use it:
Properties between 5,000-6,500 square meters
| Location | Size (sqm) | Price | Price/sqm |
|---|---|---|---|
| Escazú, Costa Rica | 5,116 | $1,595,000 | $312 |
| Granada, Spain | 5,590 | $4,105,485 | $734 |
| Tarzana, California | 6,475 | $6,845,000 | $1,057 |
| Pinecrest, Florida | 5,642 | $10,950,000 | $1,941 |
| Palm Beach, Florida | 5,766 | $157,000,000 | $27,229 |
Same size range. 87x price difference between the lowest and highest.
These properties share similar square footage. They don’t share markets, waterfront access, or the factors that drive value in luxury real estate.
Price per square foot assumes the square footage is what you’re buying. It’s not.
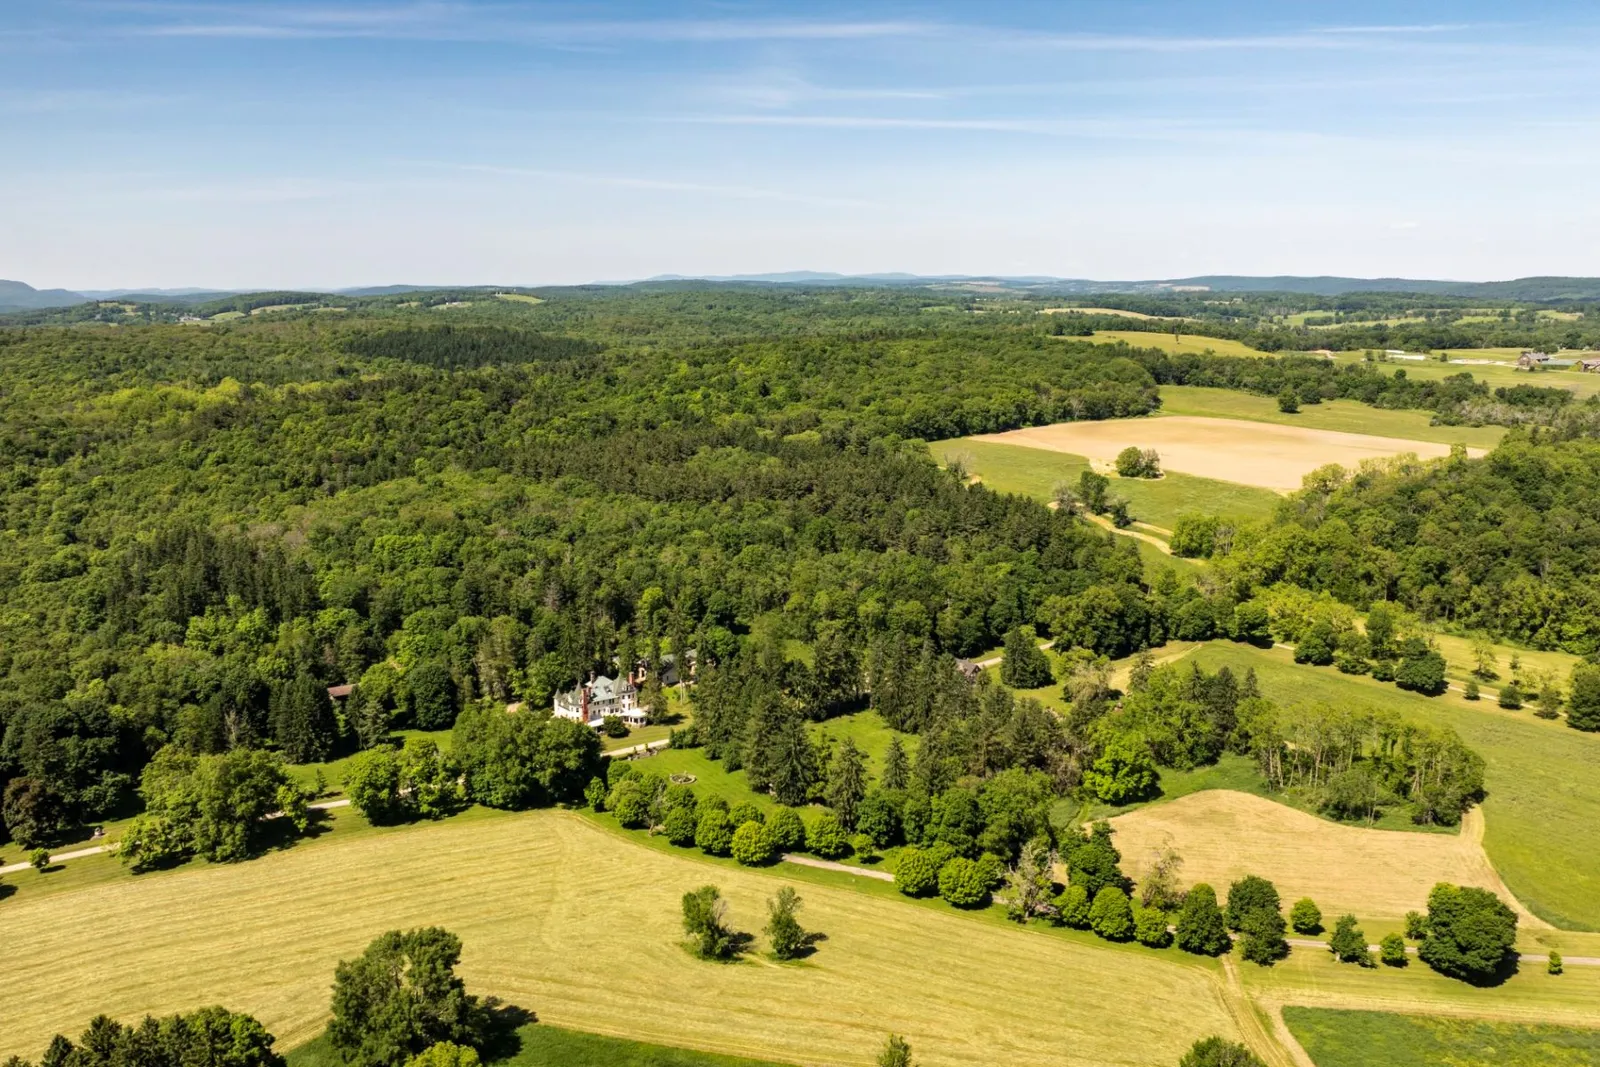
The Waterfront Pattern in Our Portfolio
Across properties with size data, waterfront estates in the portfolio show a median price of $34.5 million. Inland estates sit at $9 million.
The 3.8x differential reflects more than preference. Waterfront represents finite supply, protected views, regulatory barriers to development, and in many cases, the reason the estate exists in that location at all.
An inland estate can span hundreds of acres where land allows. A waterfront estate occupies whatever the shoreline permits. The price-per-square-meter difference (2.6x in this dataset) appears to reflect this scarcity—you’re paying for land that cannot be replicated.
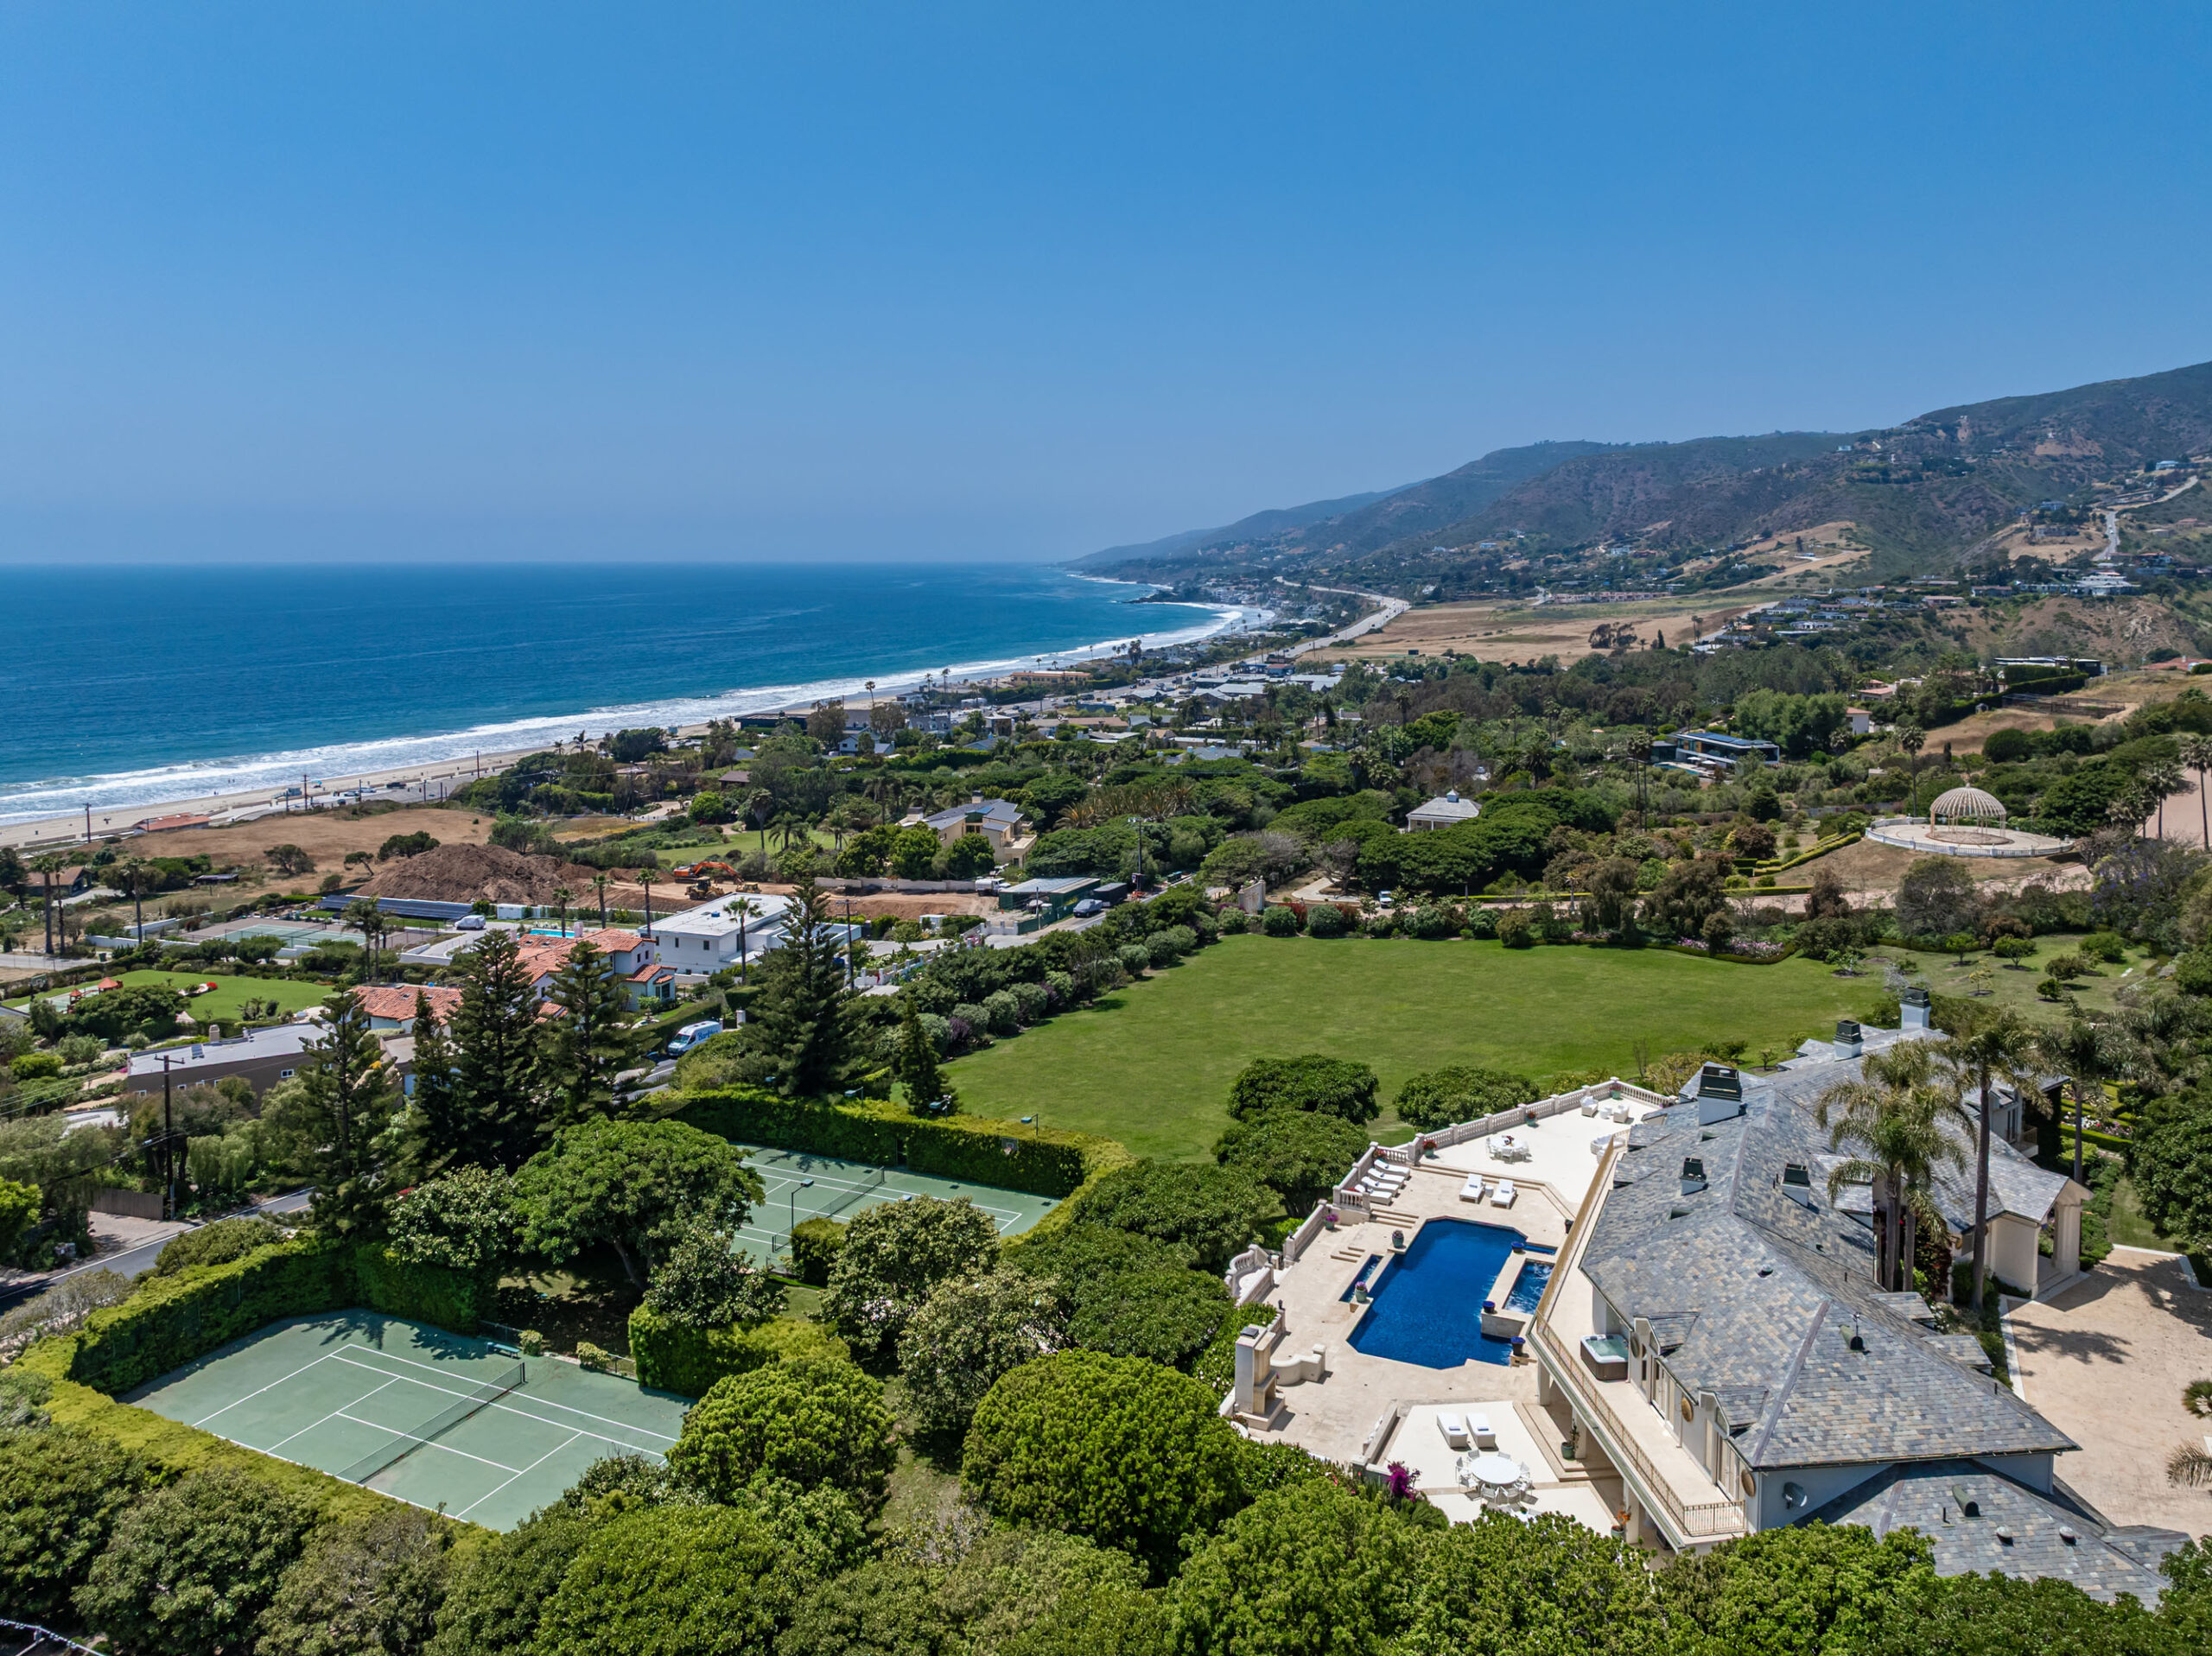
The portfolio includes a 2,091-acre estate in Millbrook, New York priced at $68 million ($8/sqm) and an oceanfront estate in Malibu priced at $110 million ($6,630/sqm).
These represent different asset classes despite both being tennis estates. One offers privacy and conservation land. The other offers coastal position in a supply-constrained market. Price per square foot treats them as comparable. The market doesn’t.
Surface Type and Price: What the Portfolio Shows
Har-Tru courts are objectively more expensive to install and maintain than hard courts. Yet in this portfolio, Har-Tru properties (median $12.5M) are priced lower than hard court properties (median $10.7M) on a per-square-meter basis—$578/sqm versus $1,209/sqm.
The pattern suggests surface type correlates with price primarily to the extent it correlates with location. Har-Tru properties in the dataset appear in Asheville, Bellport, and Water Mill. Hard courts span from inland estates under $2 million to coastal properties exceeding $100 million.
The portfolio’s highest-priced property—$157 million—has a red clay court. The second highest—$110 million—has a hard court. Both are waterfront. Both are in ultra-premium coastal markets. The surface type differs, but both properties are valued primarily for location, not court type.
What you’re seeing isn’t “hard courts cost more than Har-Tru.” You’re seeing that the most expensive properties happen to be in markets where hard courts dominate, and those markets drive pricing independent of surface choice.
Multiple Courts Don't Guarantee Premium Pricing
Five properties in the portfolio feature multiple courts. They range from $3 million to $75 million.
The $3 million property (Massachusetts) has multiple courts on 24,000 square meters. The $75 million property (private island in Key Largo) has multiple courts on 104,000 square meters of island.
The presence of a second court doesn’t create value. It signals that the property has space, which in certain markets reflects either low land cost (Massachusetts) or extraordinary scarcity (private island).
Multiple courts work as a value signal only when they appear in markets where land is constrained. A second court in markets like Malibu suggests unusual acreage for that location. A second court on a large rural estate may simply reflect abundant land.
The question isn’t “does it have multiple courts?” The question is “what does having multiple courts tell you about the property’s positioning within its specific market?”
Land-Intensive vs. Improvement-Intensive Pricing
The portfolio’s largest property by acreage—2,091 acres in Millbrook—is priced at $68 million.
The portfolio’s most expensive property—1.4 acres in Palm Beach—is priced at $157 million.
Both have tennis courts. Both are described as luxury estates. One costs $8 per square meter. The other costs $27,229 per square meter.
The Millbrook estate is priced on land value—2,091 acres of conservation-zoned property in the Hudson Valley where further development is restricted. The court is an amenity on a property whose value derives from acreage, privacy, and preservation.
The Palm Beach estate is priced on location value—1.4 acres with 200+ feet of Intracoastal frontage in a market where waterfront lots rarely transact and when they do, command prices reflecting decades of restricted supply.
They represent opposite valuation frameworks: one where you’re buying land, one where you’re buying position.
The Pattern our Portfolio Suggests
Looking across the 70 properties, a pattern emerges in how they’re priced:
Tier 1: Location & Land
- Geographic market (prestige, supply constraints, regulatory environment)
- Waterfront vs. inland (3.8x median price differential in this portfolio)
- Acreage relative to market norms
- Protected views or privacy buffers
Tier 2: Main Residence Quality
- Architecture and finishes
- Integration with landscape
- Condition and age
Tier 3: Tennis Court as Differentiator
- Surface type and infrastructure
- Positioning on property
- Single vs. multiple courts (context-dependent)
This isn’t prescriptive—it’s what we observe in the data. Properties that differ primarily on Tier 1 factors show the widest price variation. Properties that differ primarily on Tier 3 factors cluster closer together in price.
The $157 million Palm Beach estate and the $110 million Malibu estate differ significantly in court type, size, and configuration. They’re priced within 30% of each other because they share Tier 1 characteristics: waterfront, ultra-premium markets, restricted supply.
The $12.5 million Har-Tru estate in Bellport and the $12.5 million hard court estate in various markets are priced similarly despite different court surfaces because neither has Tier 1 advantages that would push pricing into the $50M+ range.
What it Means
Based on what the portfolio shows, price per square foot appears to be a poor starting point for evaluating tennis estates.
The data suggests starting with location—waterfront access, market positioning, acreage context. Then the main residence. Then the court.
Until the next match,
Tennis Homes